How to Pick a City and View Its Data
Click on the city (star, square, or triangle) and its temperature data will be displayed in this window. Mouse clicking works better than touching/tapping on mobile devices because their smaller screens shrink the size of the map (and its icons) so it’s harder to select the cities. (Apologies, I’m working on it). The large buttons at the bottom of the map let you control which types of cities are displayed, either capitals, populous or interesting cities.
What will I see?
Each city begins with some background information about the city (when established, population, etc). Next comes a chart that covers the temperature ranges that city has experienced, from the first year available to the most recently downloaded date.
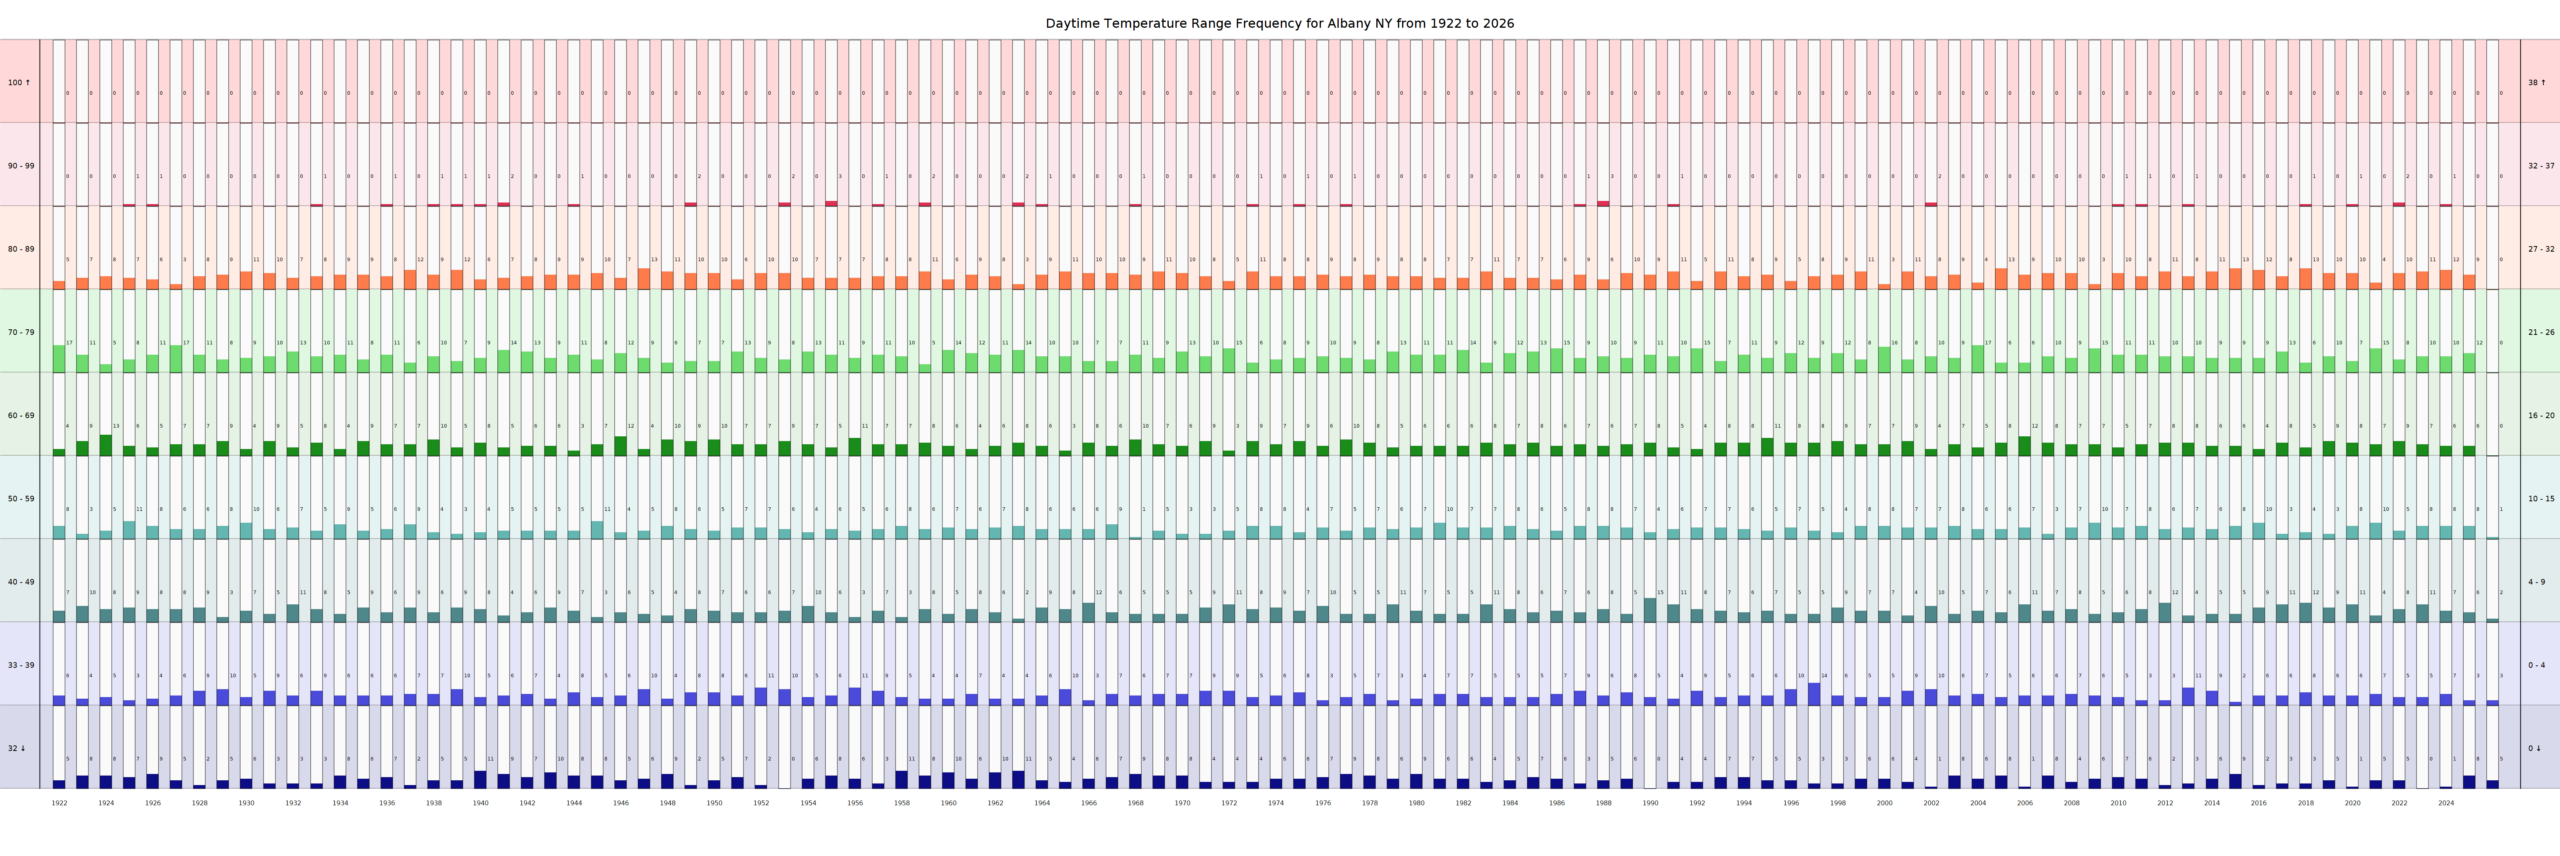
Since 100 to 150 years of daily temperature data contains as much as 50,000 data points, the data is distilled into temperature ranges and how frequently weekly temperature averages fit into one of 9 ranges. For example, Albany NY had these results 2 of its 103 years:
| Albany NY, 1922 | Albany NY, 2024 | |
|---|---|---|
| Temperature Ranges | Number of Weeks | Number of Weeks |
| 32 degrees or colder | 5 | 1 |
| 33-39 degrees | 6 | 7 |
| 40-49 degrees | 7 | 7 |
| 50-59 degrees | 8 | 8 |
| 60-69 degrees | 4 | 6 |
| 70-79 degrees | 17 | 10 |
| 80-89 degrees | 5 | 12 |
| 90-99 degrees | 0 | 1 |
| 100 degrees or hotter | 0 | 0 |
Three items stand out:
- the 4 fewer weeks of freezing day times were replaced by not by 4 weeks of near freezing temperatures but by 2 weeks in the 60’s a 1 week in the 90’s
- the 7 weeks lost in the 70’s were replaced by 7 weeks in the 80’s.
- Comparing 100+ years in table format would be mind-numbingly difficult, hence the need for the following chart, to visually review the results.
Day Time Chart
Method
This chart is generated by splitting all daily temperatures for 1 year into 52 weeks and then calculating the average temperature for each week. The number for each temperature range is recorded and then the next year’s temperature ranges are calculated by the same method. The same method is used to generate a matching chart of night time temperatures.
Purpose of Chart
Climate changes will be reflected in the number of weeks in each range; in general, warming climates will have more weeks of warm weather and fewer weeks of cold weather and cooling climates will have fewer weeks of warm temperatures and more weeks of cold weather.
Trends
By examining 100+ years of temperatures, it is easier to detect trends in our climate. In the example chart above, we can see that temperature ranges for Albany are fairly consistent, but in the 21st century (right-hand 25 columns) we see decreasing number of weeks of cold weather and a corresponding increase in the number of weeks in the 70’s and 80’s.
The night time chart frequently shows warming trends more clearly. Click on the link to view the night time chart.
View Night Time chart

Top 10,000 Temperatures by Date
Hottest Days 10K Chart
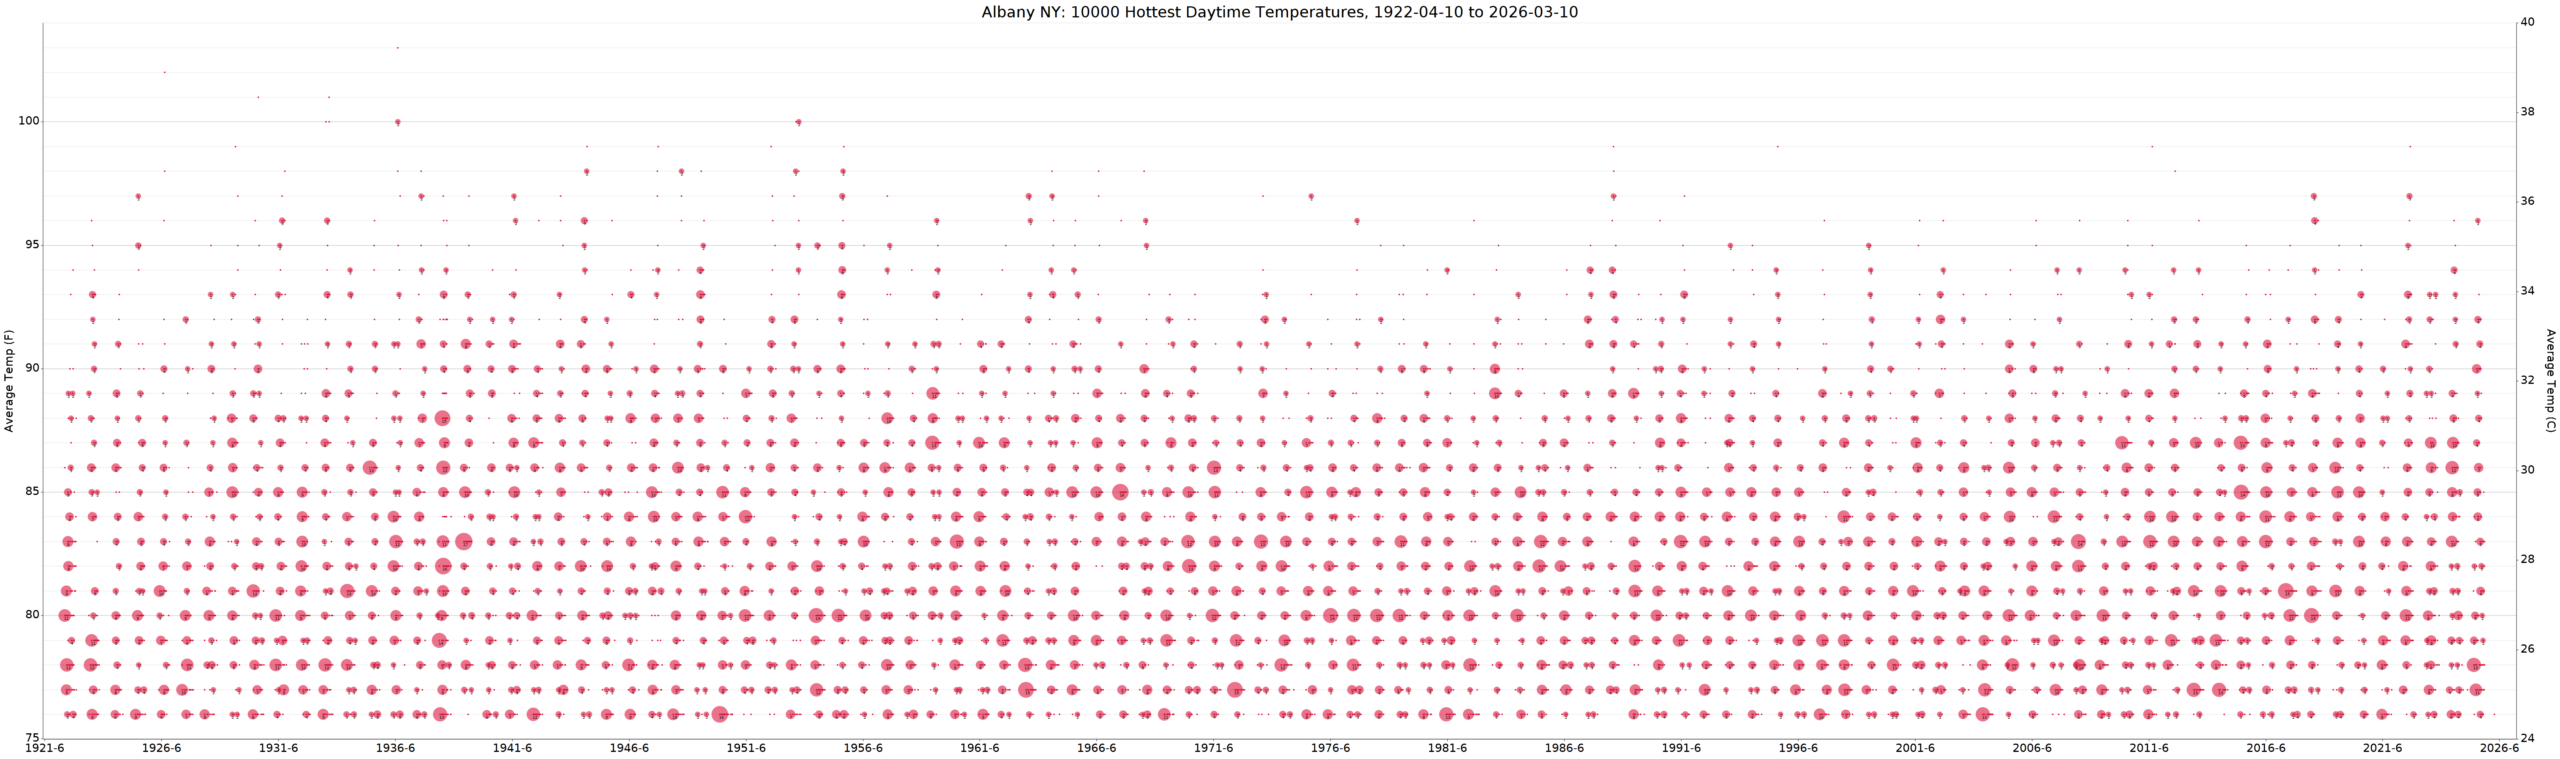
Since we have the daily temperature data for every day of every year, we can plot the 10,000 hottest day time temperatures by date. Selecting about 10,000 date/temps provides enough data to avoid biasing the chart towards a few exceptionally hot years that happen every so often. Clusters of hot days (heat waves) are combined into larger dots. Look for redder areas on the chart – that is where the hotter days are happening more frequently.
Warmest Nights 10K Chart
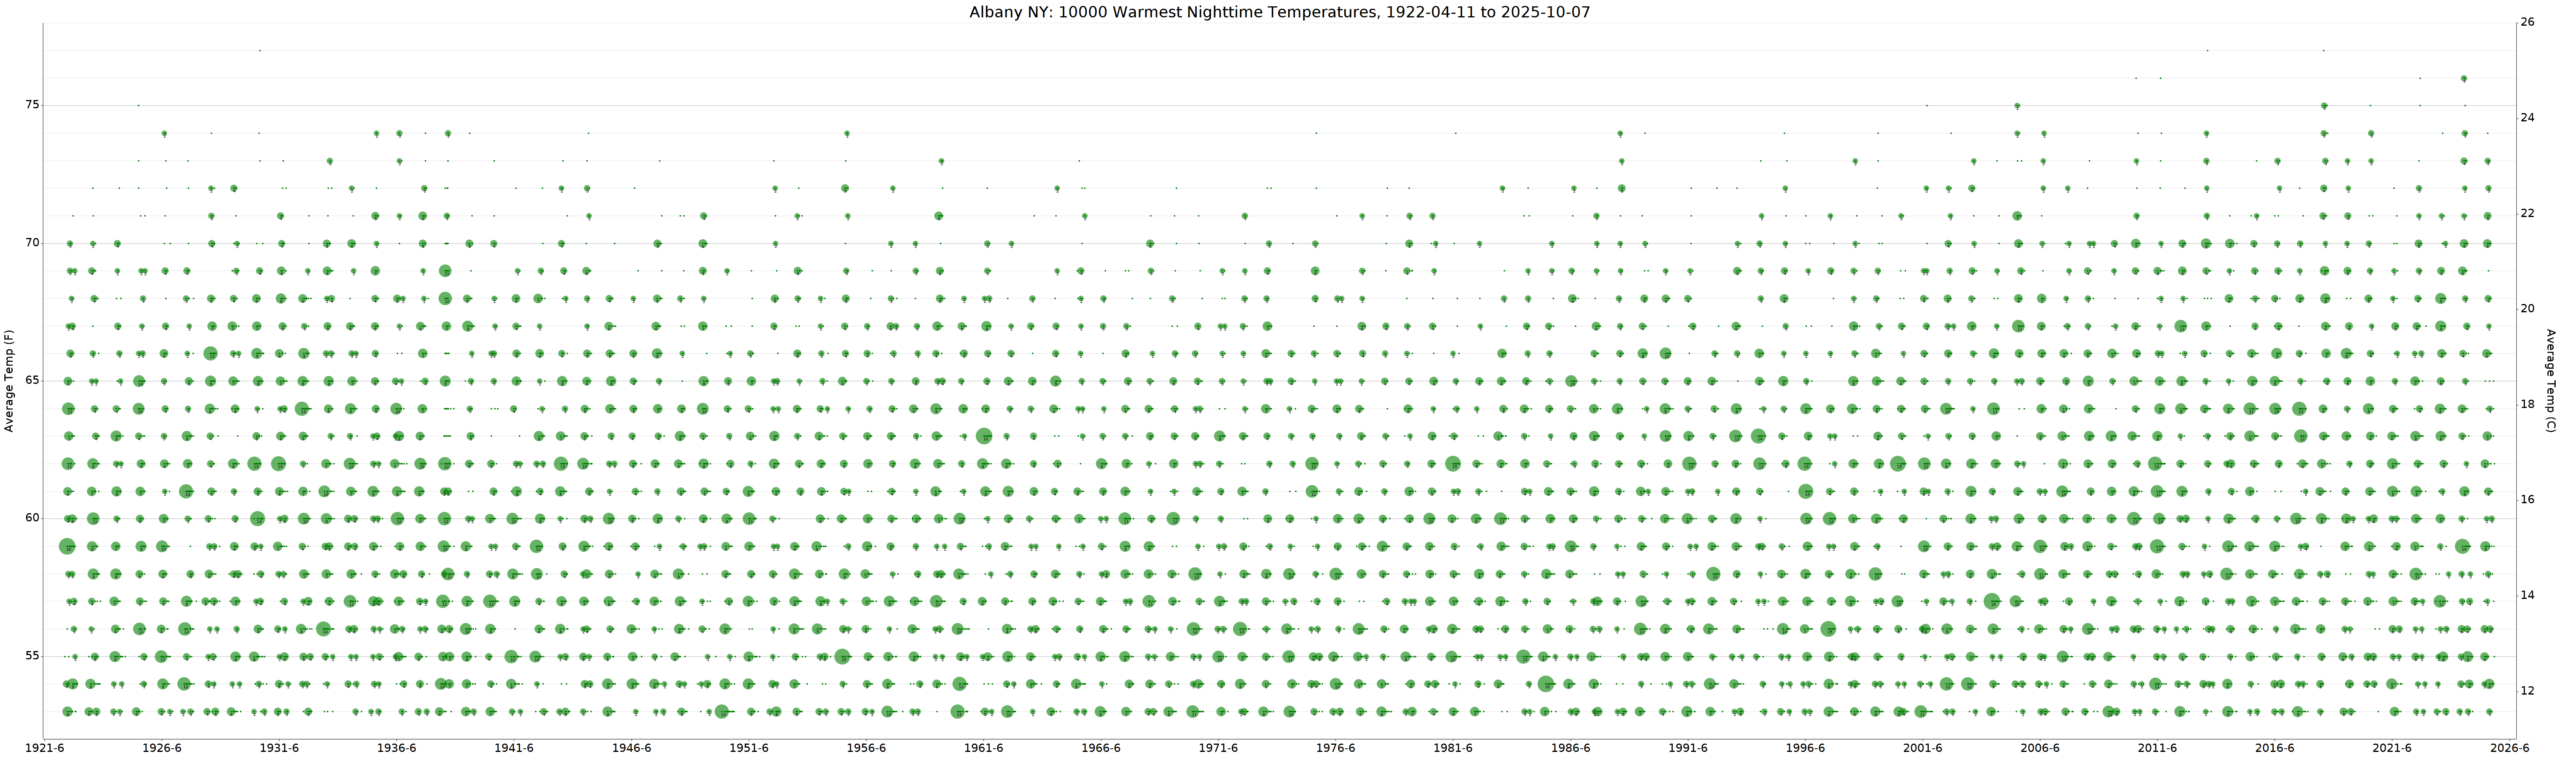
The 10,000 Warmest Nights charts is just like the Hottest Day Chart except it looks for the warmest nights. In this example, we can see it is greener in the 60 – 70 in the 1920’s and 1930’s and then it gets greener in the 55 – 65 range thru the 1980s. In the 1990s, it gets greener again in the 65 – 70 range, even getting more nights in the 70 – 75 range.
Coolest days 10K Chart

This charts shows the 10,000 coldest day time high temperatures. Much of the lower part of the above chart is empty, except for a very few exceptionally cold days. Look for the oranger parts of the chart to see where the temperatures are heading.
Coldest Nights 10K Chart
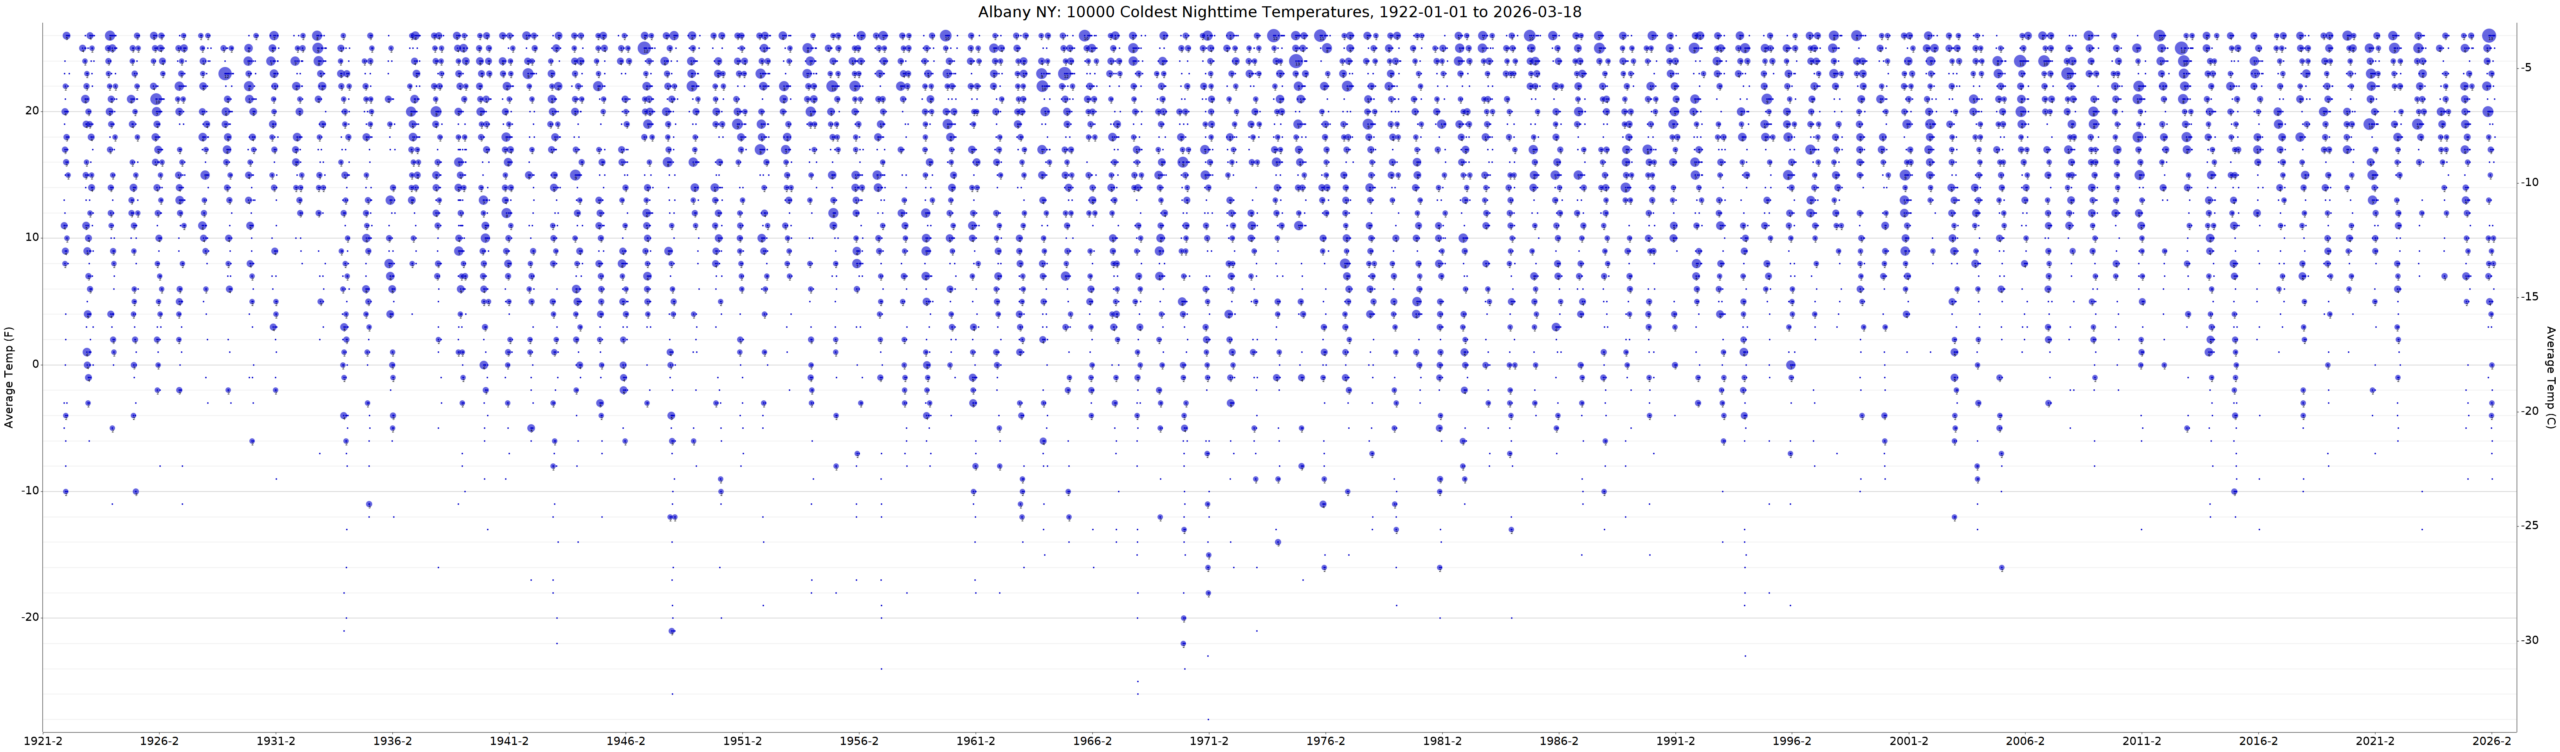
This chart shows the 10,000 coldest nights for the city. In the above chart, there seems to be a general trend towards fewer extremely cold nights since the 1970’s. Again, look for bluer sections of the chart to see where the temperatures are going.
Other info
Every city’s details includes this section that contains non-weather tidbits of interesting information about the city. Perhaps the city was incorporated very early (Albany was incorporated in 1690, for example) or that the city never had a large population or that the city was most important during the Gold Rush Days of 1849. Hopefully you’ll find then as interesting as I did.